Introducing VaR
Value at Risk, for frontier models. A finance LLM benchmark for asset managers: AI models evaluated on 9 private eval sets built from 259 real buy-side workflows.
Introducing VaR
Oct 20, 2026
Value at Risk, for Models.
In the early 1990s, JPMorgan's chairman Dennis Weatherstone asked for one number on his desk at 4:15 every afternoon: “how much could the bank lose tomorrow?” That number became Value at Risk. JPMorgan published the method in 1994, and within two years regulators had written it into bank capital rules.
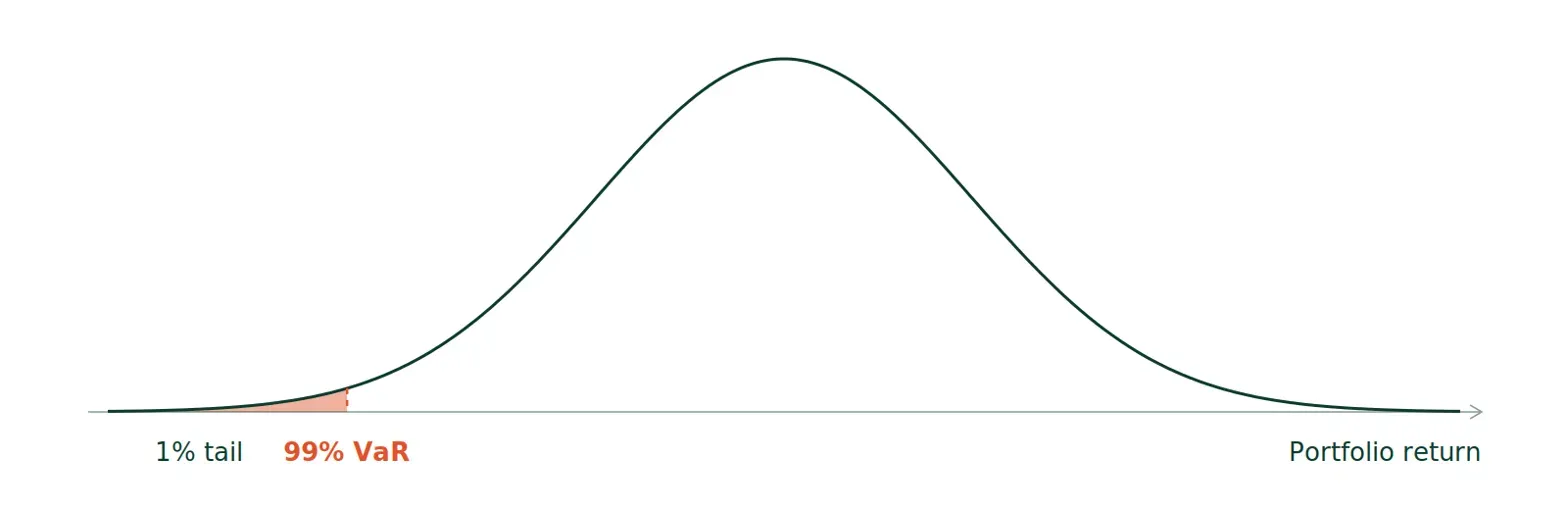
It won because it answered the question investors actually care about. Not how you do on an average day, but how bad it gets on a bad one.

AI in investing has no such number.
Models are ranked on averages, and an average hides the one step where a model quietly fails. VaR is that number for models, and it is how we decide which model runs each step of an investment workflow inside Terminal X.
We ran 22 models through 259 graded runs on 9 evals that cover every stage of our pipeline. No model leads every stage, and the model with the best average is not always the one you can trust on its worst stage.
Why we built VaR
Investment teams run sensitive work on Terminal X every day, and the quality they get depends on which model sits behind each step. New frontier models now ship every few weeks. We needed a repeatable way to test each one on our own work, inside our own pipeline, before it touches a client.
Public benchmarks don't answer that question. They grade models on generic tasks, in harnesses built only for testing, on cases that end up in the next generation of training data. And they grade on averages.
In investing, the average never hurts you. The tail does. One misread filing or one missing figure in an IC brief, and the rest of the answer stops mattering. So VaR asks of a model what Value at Risk asks of a portfolio: across every stage of the work, where is it weakest, and how weak?
What VaR measures
Terminal X Agent answer is a chain. A document comes in, gets understood, gets found again when a question needs it, and becomes part of an answer. VaR tests each link separately, because an answer is only as good as its weakest stage.
- Processing: reading a document and extracting what retrieval will need later. Evals: data room document typing, document metadata from page images, and chunk metadata from page images.
- Retrieval: given fixed inputs, picking the right source and pulling the right numbers. Evals: filing selection, and table answers built from Bloomberg data, web search, broker research and company presentations.
- Final answer: given fixed inputs, writing an answer with the right information in the right structure. Eval: final answer generation, graded on content and in head-to-head comparisons.
Every eval runs on golden inputs: constant inputs isolated from upstream changes, so a score reflects the model at that stage and nothing else. Each has an answer key written against the production prompt the model actually runs, by people with buy-side domain knowledge.
Eval sets range from 19 to 28 cases each, 214 cases in all, built from real investment workflows. They stay private, so every score reflects a model seeing the work for the first time.
We run each model at several settings, such as reasoning effort and verbosity, and report each model at its best setting for each stage. We also log cost and latency for every run, because a model that is right but takes four minutes per step doesn't work in production.
Two numbers summarize a model:
- Average: its score on each stage as a share of the best model's score on that stage, averaged across the stages it completed.
- Floor: the same measure on its single weakest stage. This is the VaR number. A model with a high average and a low floor is excellent most of the time and unreliable somewhere you can't see from the average.
Results
Six different models post the top score on at least one stage, and every model has at least one stage where it falls well behind. The right model depends on the step, which is why Terminal X routes each step to a different model rather than running one model end to end.
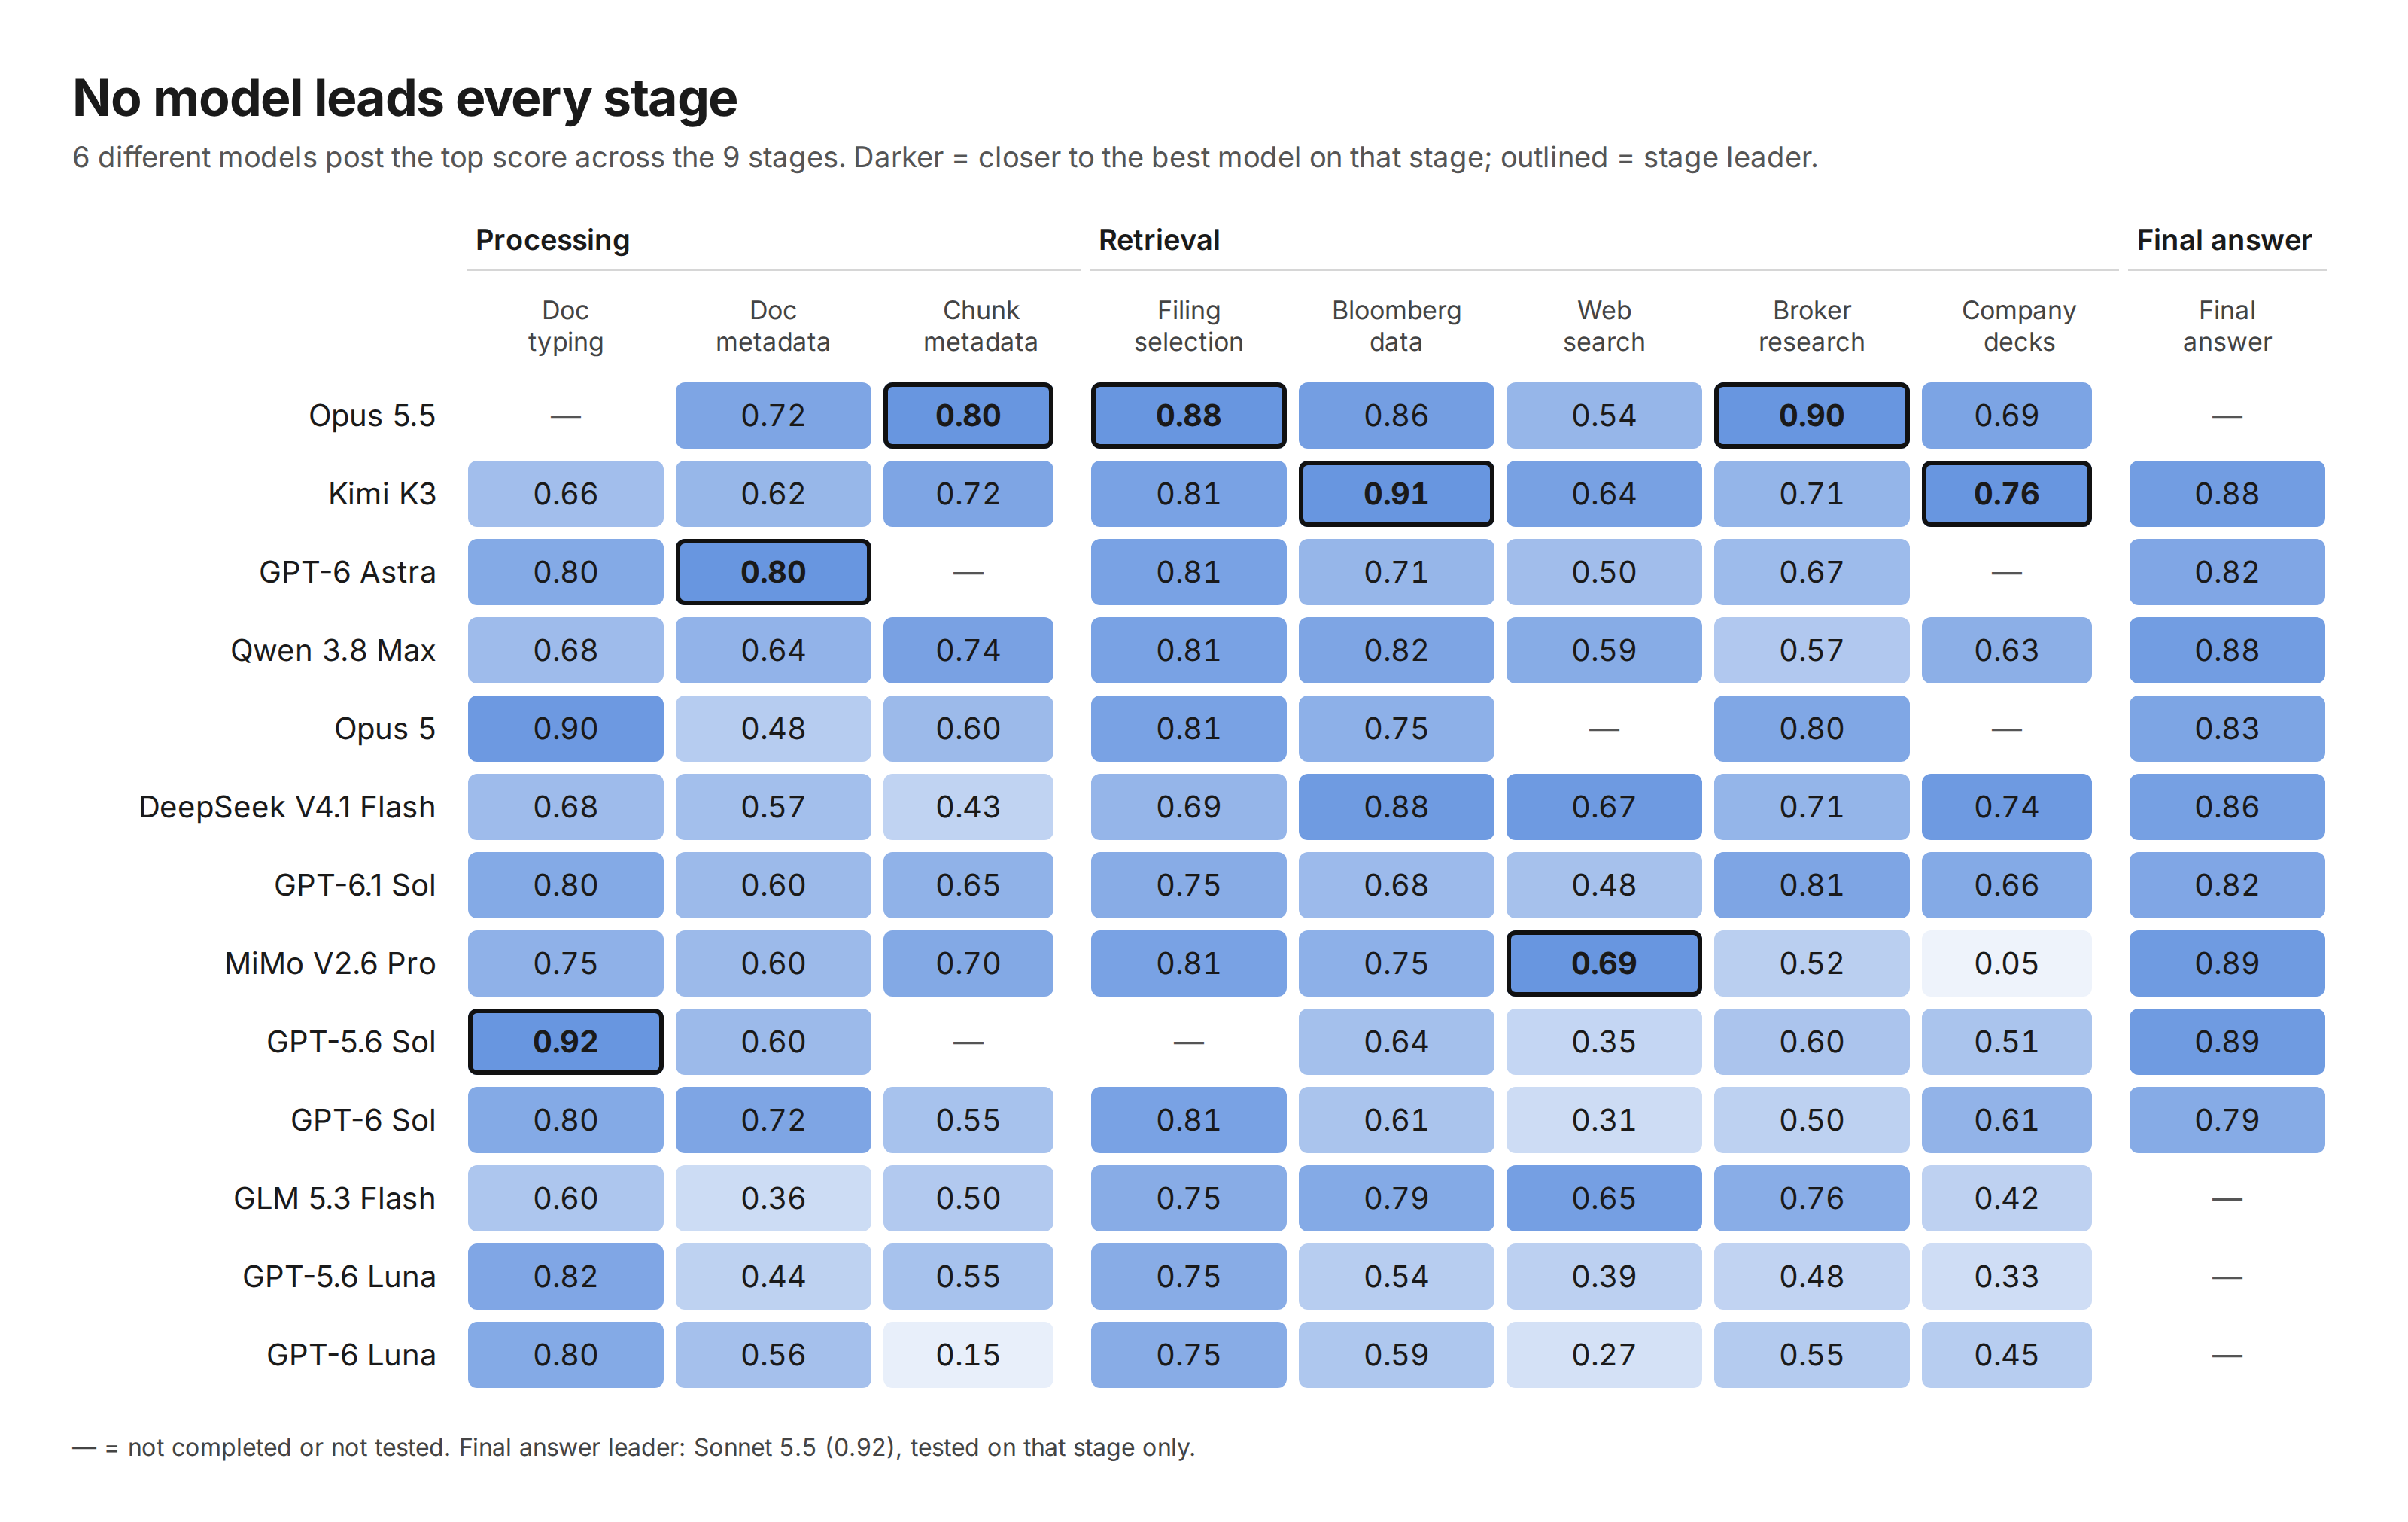
The thirteen models shown completed at least seven of the nine stages. Scores are each eval's own scale, so compare models within a column, not across columns: web search is hard for everyone, and a 0.69 there is the best result in the set.
The floor (our 'VaR')
The floor is where a model can hurt you. Ranked by average, the order looks familiar. Ranked by floor, it changes.
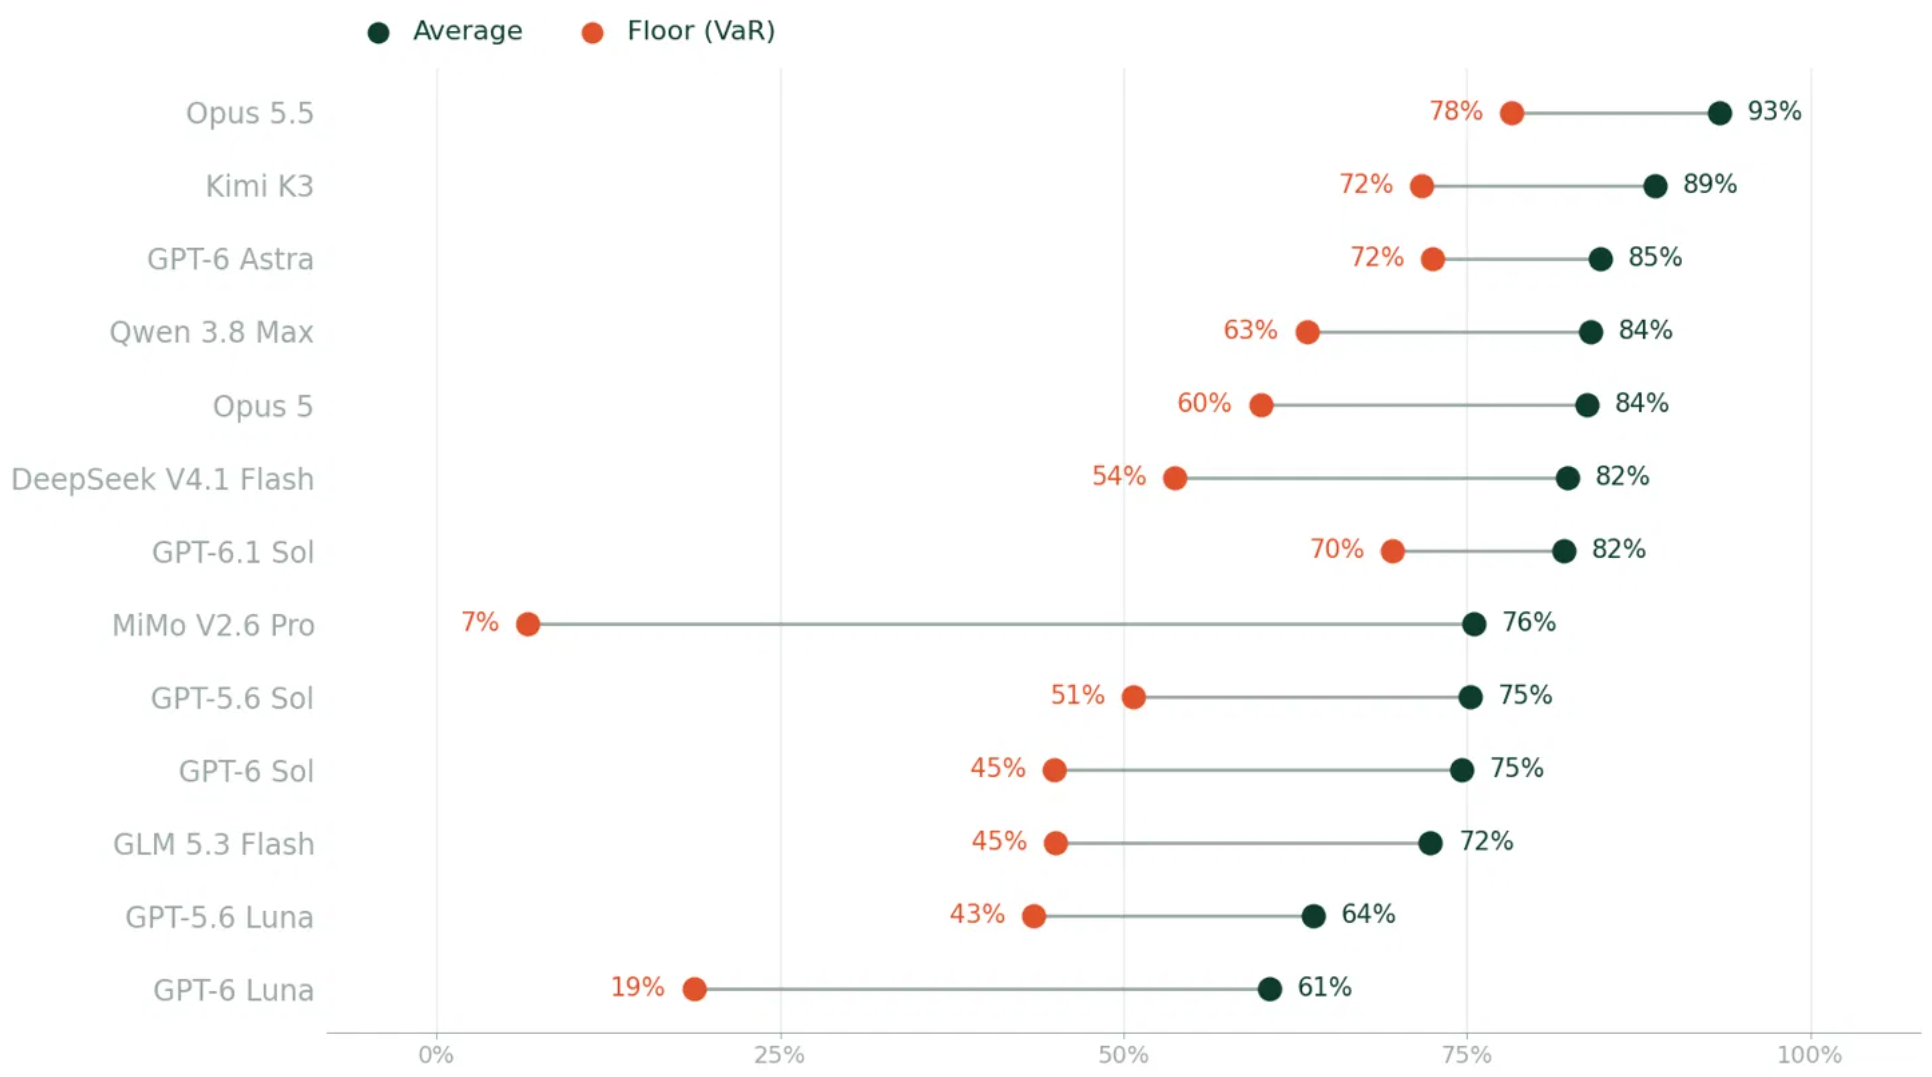
Opus 5.5 has both the best average and the best floor among models that finished at least seven stages. Kimi K3 and GPT-6.1 Sol are the most even across all nine. MiMo V2.6 Pro averages 76% of the best model but drops to 7% on one stage, and GPT-6 Luna drops to 19% on chunk metadata from page images.
What we learned
- The top average came with a reliability tail. Opus 5.5 posted the best average and the highest floor of any model that completed at least seven stages, and the top scores on broker research (0.90), filing selection (0.88) and chunk metadata (0.80). But on final answer generation it failed roughly every other run on safety refusals, so we could not score it, and it declined our data room document typing prompt as malicious. In production a refusal is a failure, so those two stages count against it in our model selection even though they cannot appear in its score.
- One stage can sink a strong model. MiMo V2.6 Pro had the best web search score in the set (0.69) and one of the best final answer scores (0.89), then scored 0.05 on company presentation table answers. Its floor is 7% of the best model on that stage. An average would hide that completely. VaR exists to catch exactly this.
- Consistency is its own skill. Kimi K3 was the only model to complete all nine stages with a floor above 70%, and it led two of them: Bloomberg data answers (0.91) and company presentations (0.76). The cost is speed, with a median of about 34 seconds per case and over three minutes on final answers.
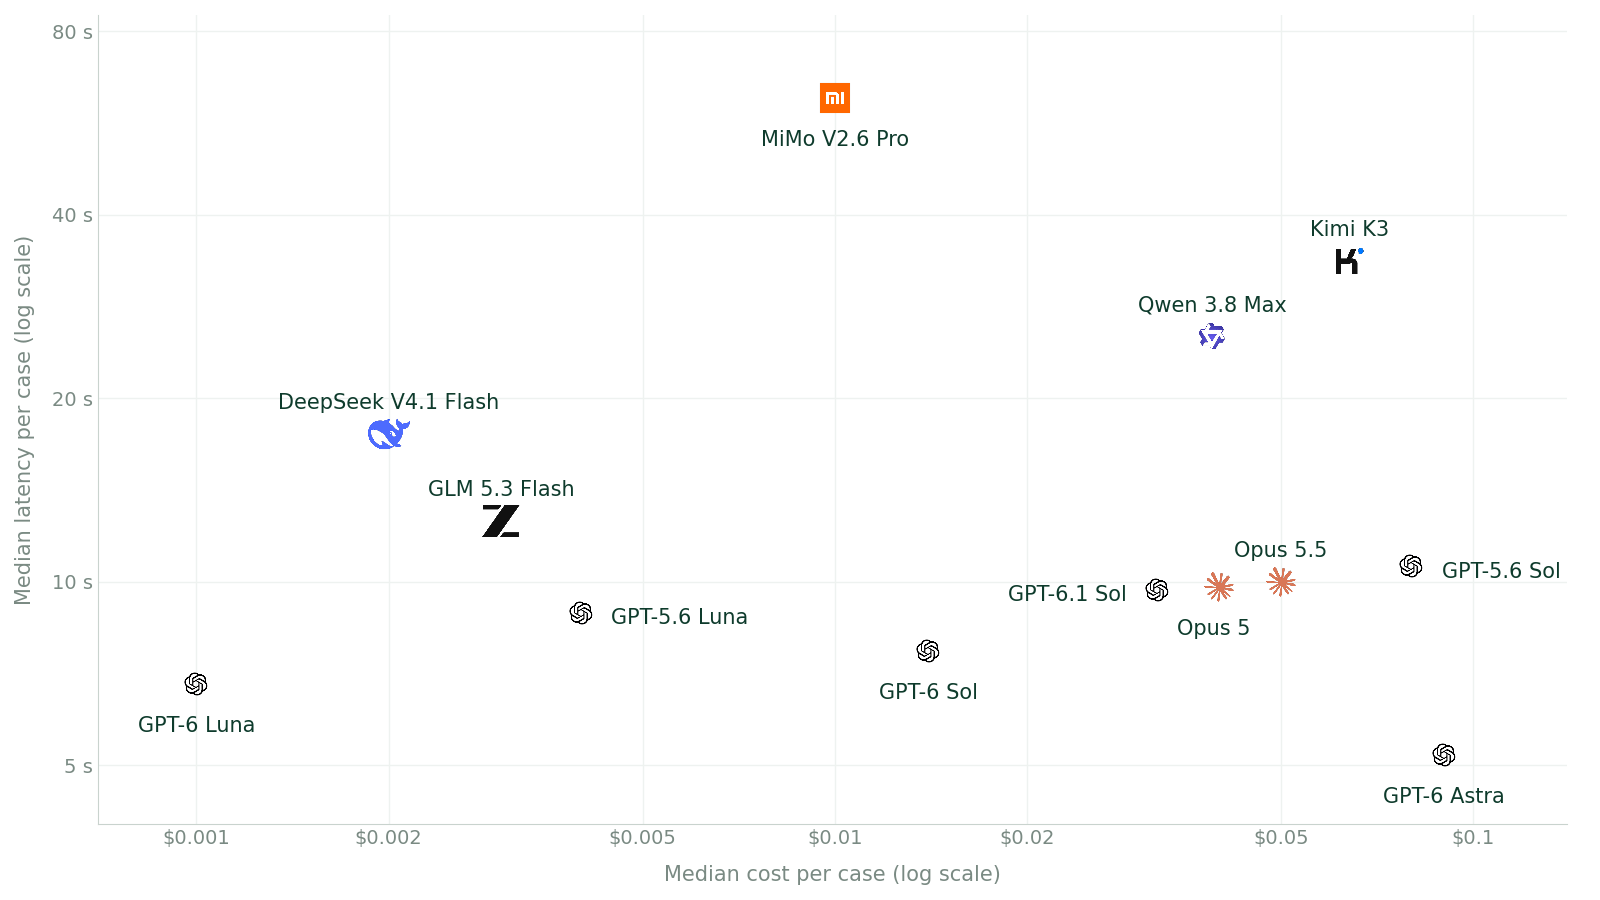
- The cheapest model is close on some stages and far on others. DeepSeek V4.1 Flash costs about $0.002 per case at the median, roughly one twenty-fifth of Opus 5.5, and scored 0.88 on Bloomberg data answers and 0.86 on final answers. Its floor is chunk metadata from page images, at 54% of the best model. More reasoning often made it worse: on chunk metadata, maximum thinking scored 0.35, against up to 0.45 at low thinking. These runs predate DeepSeek's October 17 update.
- Head-to-head preference and content scores can disagree. GPT-5.6 Sol still writes our final answers. Sonnet 5.5 posted the highest content score on that stage (0.92 against Sol's 0.88), yet reviewers preferred Sol's answer in 64% of head-to-heads. Sol won the head-to-head against every challenger we ran, from 60% against GPT-6.1 Sol to 100% against several others. Among OpenAI's newer models, GPT-6.1 Sol is the most balanced, with a 70% floor and the second-best broker research score (0.81).
- Web search is the hardest stage for everyone. The best web search score was 0.69, the lowest top score of any stage, and it was the weakest stage for five of the thirteen ranked models, including Opus 5.5, GPT-6 Astra, GPT-6 Sol and GPT-6.1 Sol.
This can sound counterintuitive, as most of our clients initially had thought it would be the easiest stage. But it is the least forgiving. Bloomberg data, for example, has one canonical value per figure, and a broker report or company deck is curated by a single, validated entity, heavily footnoted with every primary source. The web is a total jungle. It gives the same metric from a dozen (invalid) sources, some stale, some rounded, some on a different fiscal period, overall too much noise in every figure. More trash than signal. Web search was the weakest stage for five of the thirteen ranked models, including Opus 5.5, GPT-6 Astra, GPT-6 Sol and GPT-6.1 Sol.
Cost and latency
Median cost per case varies more than 60-fold across the ranked models, and median latency more than 10-fold. Medians are across each model's best setting on every stage it completed.
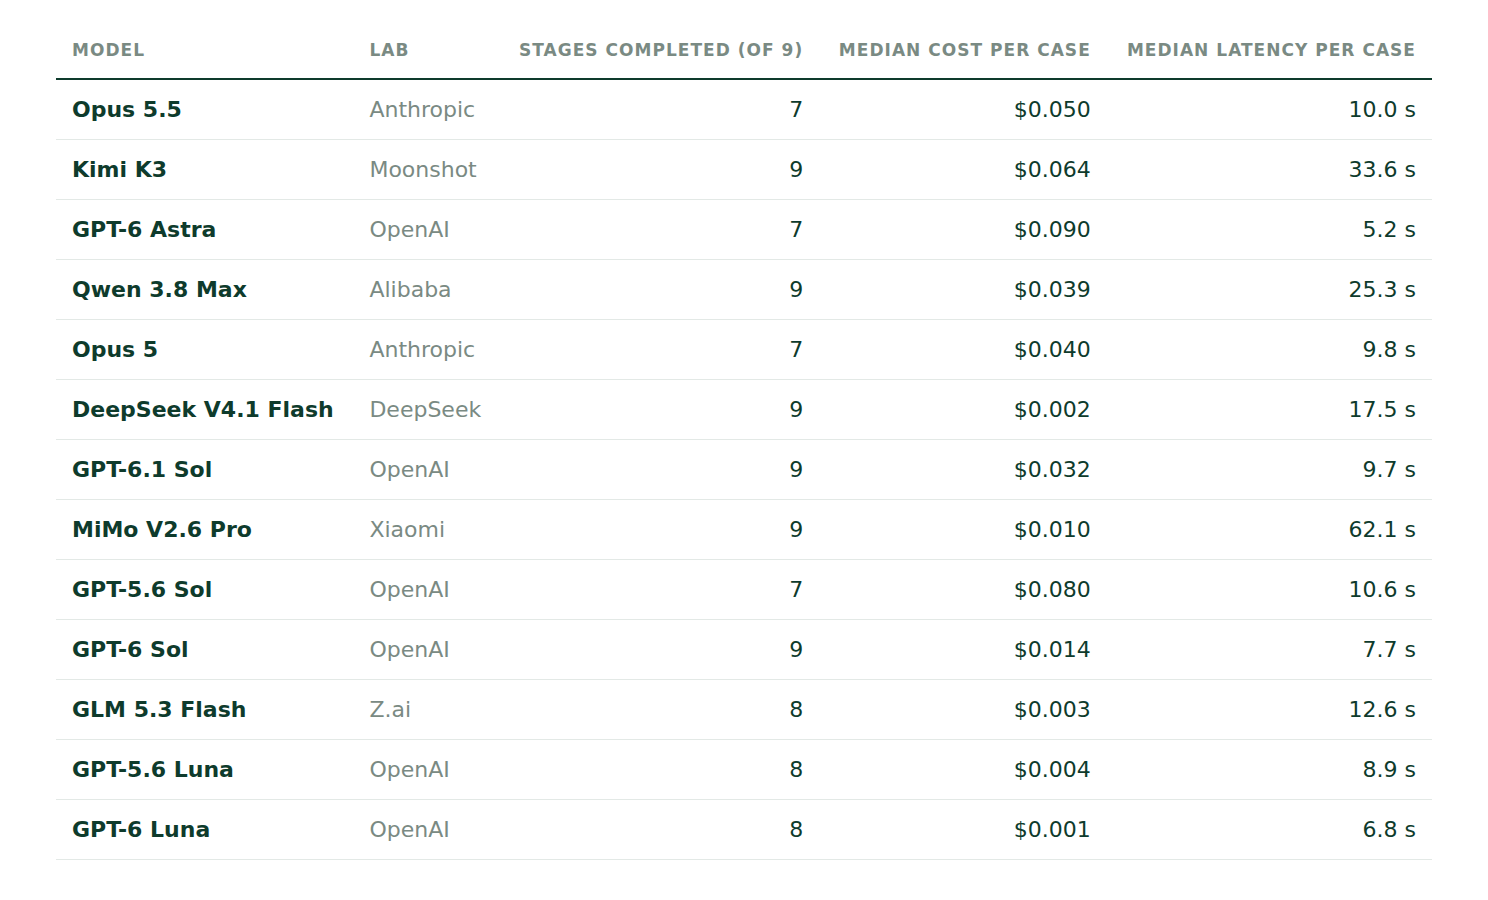
Costs use public list prices. Gemini 3.8 Flash, which runs our research agent today, and Sonnet 5.5 were tested on fewer than seven stages and are not ranked.
Example prompts
These come from our report and research agent eval sets. Alongside the scored stages, we compare full deliverables side by side.
Private equity · QoE reconciliation
UUsing the CIM, the sell-side quality of earnings report and the management model in the Project Atlas data room, reconcile management's adjusted EBITDA for LTM June 2026 to the QoE's. List each add-back, whether the QoE accepts it, and the page it comes from. Then compare the proposed 6.0x senior leverage and covenant package with our last three healthcare services deals.
What we check: Every add-back is tied to a page in the data room, not paraphrased from the CIM. The agent flags run-rate and pro forma adjustments the QoE rejects or haircuts, and the bridge between the two EBITDA figures sums exactly. Prior deal terms come from the firm's own deal records, not public comps.
Real estate · NOI underwriting check
For the 240-unit multifamily acquisition in the Phoenix data room, recompute in-place NOI from the T-12 and the current rent roll, and compare it with the NOI in the broker's offering memorandum. Flag concessions, loss-to-lease, expired leases still counted as occupied, and any expense line where the OM uses a pro forma figure instead of the T-12. Cite the source line for each adjustment.
What we check: Rent roll totals reconcile to T-12 revenue before any adjustment is made. The agent catches where the OM departs from actuals, such as taxes not reset to the purchase price or payroll and insurance below trailing levels, and shows the NOI gap line by line. Nothing comes from market data the user didn't provide.
Capital allocator · fund re-up diligence
A manager is raising Fund V and we are deciding whether to re-up. Using our capital account statements and the last eight quarterly reports for Fund IV, compute Fund IV's net IRR and TVPI from our own cash flows and compare them with what the GP reports. Then compare Fund V's LPA terms on key person, fee offsets, GP commitment and recycling with the last two funds we committed to with this manager.
What we check: Performance is computed from the LP's actual cash flows, with gross and net kept separate. The agent notes where a subscription line flatters reported IRR, and every LPA term change is cited by clause and compared against the firm's own prior commitments.
Next steps
VaR runs continuously, the way a risk desk recalculates its VaR every day. Every new model goes through the same nine stages before it can touch a client workflow, and every result feeds back into which model runs which step.
We are also adding a tenth eval for our research agent's tool calling: six fixed cases scored on source selection, parameters, escalation to primary records, rules and scope, desk notes and coverage. DeepSeek V4.1 Flash 1017 and the other October releases are in the queue.
If you are an investment firm or a lab that wants to help define how AI is measured in investing, reach out to your Terminal X rep.
More insights

Nvidia's $250 Billion OpenAI Backstop and the Semiconductor Slump
What the Reported Guarantee Does (and Doesn't) Buy
Private Credit Crisis: Bubble or Business as Usual?
Looking for stability in an opaque industry

From AI Agents to Institutional Memory: What's Next for Real Estate
Terminal X London with DWS | How AI is transforming Real Estate Investment: from underwriting and asset management